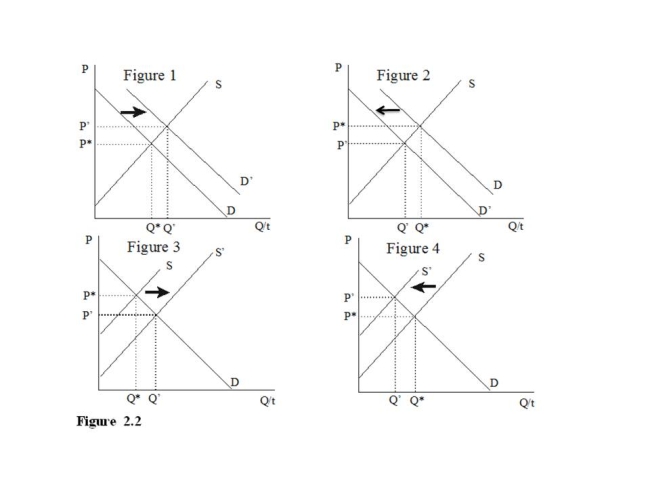
-Of the collection of supply and demand diagrams in Figure 2.2, which one(s) could show the result of a decrease in income?
A) Figure 1
B) Figure 2
C) Figure 3
D) Figures 1 and 2
Correct Answer:
Verified
Q139: In the market for birth control devices,
Q140: If two goods are considered substitutes and
Q141: The decrease in the number of sellers
Q142: The increase in the price of a
Q143: If a subsidy (going to producers)is created
Q145: The increase in the number of sellers
Q146: If demand decreases and the price doesn't
Q147: If demand increases and the price doesn't
Q148: If there is an expectation that the
Q149: The increase in technology used to produce
Unlock this Answer For Free Now!
View this answer and more for free by performing one of the following actions

Scan the QR code to install the App and get 2 free unlocks

Unlock quizzes for free by uploading documents