Multiple Choice
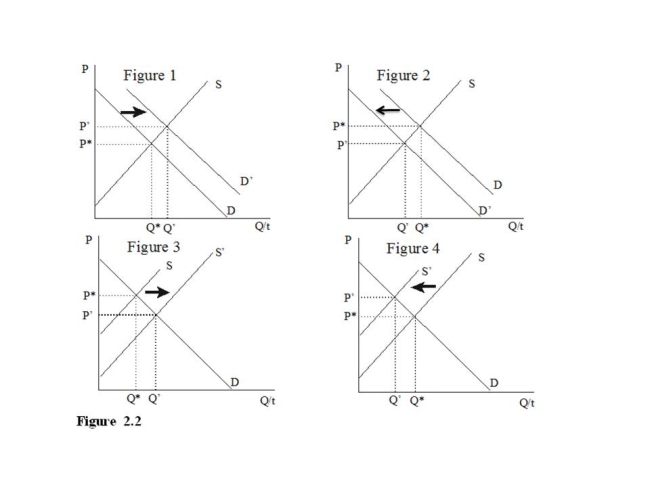
-Of the collection of supply and demand diagrams in Figure 2.2 which one(s) show the result of an increase in the expected future price?
A) Figure 1
B) Figure 4
C) Figures 2 and 3
D) Figures 1 and 4
Correct Answer:
Verified
Related Questions

