Use the following to answer question(s) : Shifts in Demand and Supply
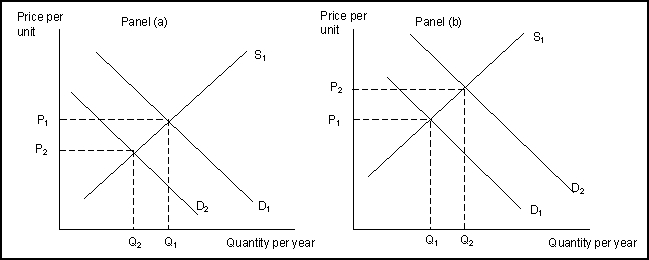
-(Exhibit: Shifts in Demand and Supply) Which graph best illustrates what happened in the desktop calculators market when handheld calculators were invented and came on the market?
A) the movement from M to N in Panel (a) .
B) the movement from O to P in Panel (b) .
C) the movement from N to M in Panel (a) .
D) the movement from P to O in Panel (b) .
Correct Answer:
Verified
Q180: An increase in supply with no change
Q186: If both the demand for a product
Q187: Use the following to answer question(s): Shifts
Q189: Given that milk and cookies are complements,
Q190: If both the demand for a product
Q193: Use the following to answer question(s): Demand
Q194: Given that milk and cookies are complements,
Q195: Use the following to answer question(s): Simultaneous
Q196: An increase in demand and a decrease
Q196: Use the following to answer question(s): Demand
Unlock this Answer For Free Now!
View this answer and more for free by performing one of the following actions

Scan the QR code to install the App and get 2 free unlocks

Unlock quizzes for free by uploading documents