Figure 7-1
Use the graph below to answer the question(s) . 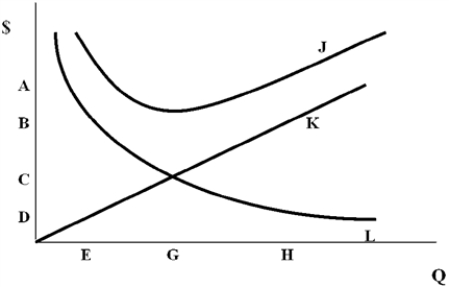
-Which of the following is TRUE in relation to Figure 7-1?
A) Curve J represents the annual ordering cost,and curve K represents the annual holding cost.
B) A lot size of G has an annual total cost of about C.
C) At lot size H both holding costs and ordering costs exceed the annual total cost.
D) The EOQ is most likely lot size G,and curve L is the annual ordering cost curve.
Correct Answer:
Verified
Q28: The EOQ model with quantity discounts attempts
Q29: Use this information below to calculate the
Q30: _,such as lubricants for machines,are used in
Q31: Use the graph below to answer the
Q32: Which of the following is not an
Q34: The cost of a widget is $5,and
Q35: Which one of the following statements regarding
Q36: Dependent demand and independent demand items differ
Q37: If your company had an annual purchase
Q38: If an item is ordered at its
Unlock this Answer For Free Now!
View this answer and more for free by performing one of the following actions

Scan the QR code to install the App and get 2 free unlocks

Unlock quizzes for free by uploading documents