Multiple Choice
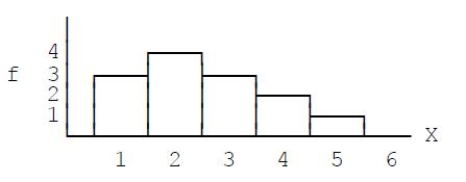 Figure 2-2
-What is the shape for the distribution shown in the accompanying graph in Figure 2.2?
A) positively skewed
B) negatively skewed
C) symmetrical
D) normal
Correct Answer:
Verified
Related Questions
Q19: What kind of frequency distribution graph shows
Q20: For the following distribution,what is the
Q21: What kind of frequency distribution graph shows
Q22: If a set of exam scores forms
Q23: For the distribution in the following
Q25: What term is used to describe the
Q26: For the distribution in the following
Unlock this Answer For Free Now!
View this answer and more for free by performing one of the following actions

Scan the QR code to install the App and get 2 free unlocks

Unlock quizzes for free by uploading documents