The Following Questions Refer to the graph below. 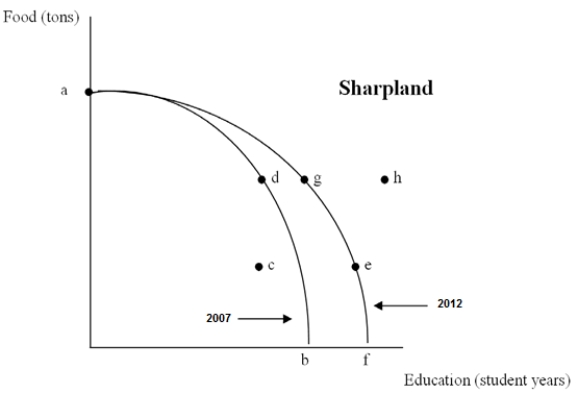
-Which of the following best explains the shift of Sharpland's PPC between 2007 and 2012? An increase in
A) The number of tractors
B) General technology
C) Agricultural land resources
D) The quality and quantity of teachers
E) The demand for schooling
Correct Answer:
Verified
Q31: If a country's GDP increases from $1m
Q32: The Following Questions Refer to the graph
Q33: The Following Questions Refer to the graph
Q34: While per capita GDP is a useful
Q35: If education and food are the two
Q37: Gross Domestic Product (GDP)is defined as
A)The total
Q38: Suppose that Gross Domestic Product for 2012
Q39: The Following Questions Refer to the graph
Q40: Which of the following provides the best
Q41: The well-being of LDCs,as measured by per
Unlock this Answer For Free Now!
View this answer and more for free by performing one of the following actions

Scan the QR code to install the App and get 2 free unlocks

Unlock quizzes for free by uploading documents