refer to the following diagram: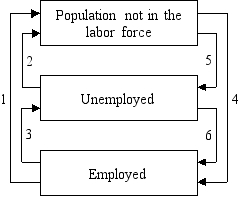
-An increase in the unemployment rate may be caused by a(n) :
A) increase in flow 1
B) increase in flow 2
C) decrease in flow 5
D) increase in flow 6
Correct Answer:
Verified
Q14: refer to the following diagram: Q15: Since 1960,the employment-population ratio has: Q16: refer to the following diagram: Q17: refer to the following information: Q18: If jobless persons who had given up Q20: refer to the following information: In Q21: Of the 3.8 million workers displaced from Q22: According to the text,the current consensus estimate Q23: In the short run,the aggregate quantity supplied Q24: refer to the following aggregate demand-aggregate supply![]()
A)trended upward but![]()
Unlock this Answer For Free Now!
View this answer and more for free by performing one of the following actions

Scan the QR code to install the App and get 2 free unlocks

Unlock quizzes for free by uploading documents