refer to the following diagram which shows the earnings distribution for a small hypothetical economy (all figures in thousands) .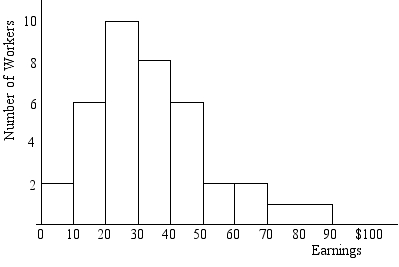
-The number of persons with annual earnings between $50,000 and $70,000 is:
A) 1,000
B) 2,000
C) 4,000
D) 10,000
Correct Answer:
Verified
Q1: refer to the following diagram which shows
Q2: refer to the following diagram which shows
Q4: The mean annual earnings in 2010 for
Q5: If an increase in the sales tax
Q6: The median annual earnings in 2010 for
Q7: The U.S.earnings distribution is:
A)skewed toward lower earnings
B)skewed
Q8: Q9: The Gini coefficient measures: Q10: refer to the following diagram which shows Q11: refer to the diagram![]()
A)the area under the![]()
Unlock this Answer For Free Now!
View this answer and more for free by performing one of the following actions

Scan the QR code to install the App and get 2 free unlocks

Unlock quizzes for free by uploading documents