refer to the following graph of the demand for and supply of armed forces personnel.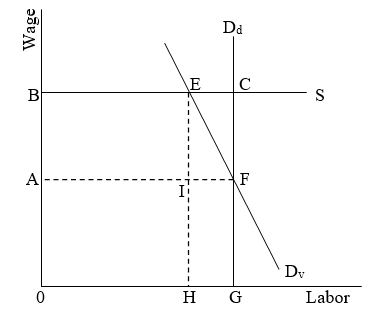
-The height of the supply curve (S) measures:
A) the cost to taxpayers of drafting a worker
B) the value to the military of drafting a worker
C) the difference between the cost to the taxpayer and the cost to the military of drafting a worker
D) the opportunity cost of a potential draftee
Correct Answer:
Verified
Q1: refer to the following graph of the
Q2: Which of the following best describes the
Q3: Because a lottery draft selects individuals with
Q4: In the public sector:
A)workers tend to receive
Q5: Research by Moulton and by Gittleman and
Q7: A partial explanation of the change in
Q8: Which of the following is an example
Q9: In the U.S.volunteer army,a typical male enlistee's
Q10: Which one of the following is not
Q11: As a percent of total employment,government employment
Unlock this Answer For Free Now!
View this answer and more for free by performing one of the following actions

Scan the QR code to install the App and get 2 free unlocks

Unlock quizzes for free by uploading documents