refer to the following diagram. Wages in both the union and nonunion sectors are initially $10. The union then negotiates a wage rate of $12. The post-negotiation nonunion wage is not yet known.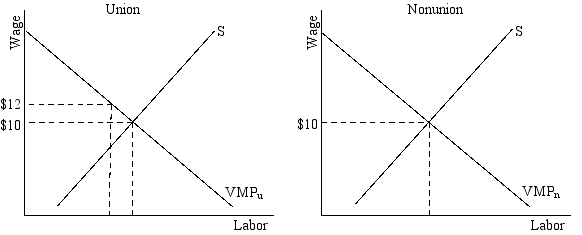
-The threat effect would be modeled by:
A) shifting the nonunion supply curve to the right,increasing the measured union wage advantage
B) shifting the nonunion demand curve to the right,reducing the measured union wage advantage
C) shifting the union demand curve to the right,increasing the measured union wage advantage
D) raising the nonunion wage above its equilibrium level,decreasing the measured union wage advantage
Correct Answer:
Verified
Q1: refer to the following diagram. Wages
Q2: If nonunion workers in a given occupation
Q3: Union workers receive more compensation than otherwise
Q4: The measured union wage advantage will understate
Q6: If Wu is the union wage
Q7: Suppose the union wage rate rises.The "spillover
Q8: The nonunion wage rate may rise as
Q9: refer to the following diagram. Wages
Q10: A union wage advantage is less likely
Q11: The measured union wage advantage may overstate
Unlock this Answer For Free Now!
View this answer and more for free by performing one of the following actions

Scan the QR code to install the App and get 2 free unlocks

Unlock quizzes for free by uploading documents