Exhibit 6.8
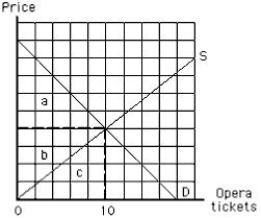
-Refer to Exhibit 6.8,which shows the market equilibrium for opera tickets.The graph shows a demand curve for opera tickets labeled D and a supply curve of opera tickets labeled S.The area _____ represents the maximum amount that consumers are willing to pay for 10 opera tickets.
A) a
B) b
C) c
D) a + b + c
E) a + b
Correct Answer:
Verified
Q150: A consumer might buy from a high-priced
Q151: Fred truthfully tells a car dealer that
Q152: Exhibit 6.8 Q153: The consumer surplus derived from the last Q154: People who use drive-through windows at restaurants Q156: If medical care is provided free of
![]()
Unlock this Answer For Free Now!
View this answer and more for free by performing one of the following actions

Scan the QR code to install the App and get 2 free unlocks

Unlock quizzes for free by uploading documents