Exhibit 7.2
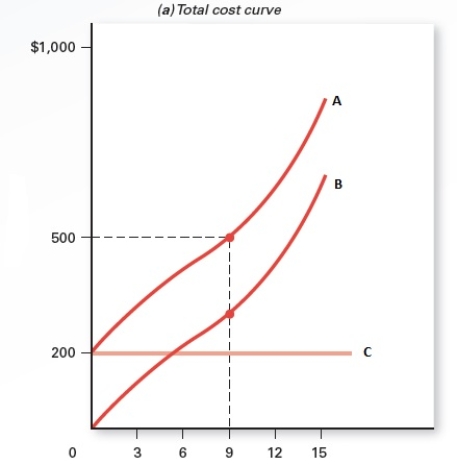
-Refer to Exhibit 7.2,which shows different cost curves.What does the difference between curve A and curve B at a total cost of $500 and an output of 9 represent?
A) variable cost
B) fixed cost
C) total cost
D) marginal cost
E) average total cost
Correct Answer:
Verified
Q121: Total cost is calculated as _
A)FC +
Q122: If marginal cost exceeds average variable cost,then
Q123: Exhibit 7.3 Q124: Exhibit 7.3 Q125: The average total cost curve and the Q127: Exhibit 7.2 Q129: Exhibit 7.3 Q130: If a firm shuts down in the Q131: Exhibit 7.2 Q155: Which of the following is true in Unlock this Answer For Free Now! View this answer and more for free by performing one of the following actions Scan the QR code to install the App and get 2 free unlocks Unlock quizzes for free by uploading documents
![]()
![]()
![]()
![]()
![]()

