Exhibit 10.6
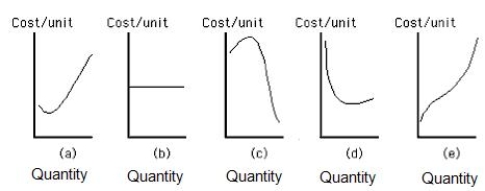
-Which of the curves shown in Exhibit 10.6 represents the long-run average cost curve for an oligopolist?
A) curve a
B) curve b
C) curve c
D) curve d
E) curve e
Correct Answer:
Verified
Q85: Which of the following industries best illustrates
Q86: Which of the following is most likely
Q87: All of the following are ways oligopolists
Q88: What is a differentiated oligopoly?
A)an oligopoly that
Q89: Exhibit 10.7 Q91: A firm in an oligopoly experiences economies Q92: It is harder to explain the behavior Q93: Interdependent decision-making on price,quality,or advertising is a Q94: Exhibit 10.7 Q95: Exhibit 10.7 Unlock this Answer For Free Now! View this answer and more for free by performing one of the following actions Scan the QR code to install the App and get 2 free unlocks Unlock quizzes for free by uploading documents
![]()
![]()
![]()

