Exhibit 11.9
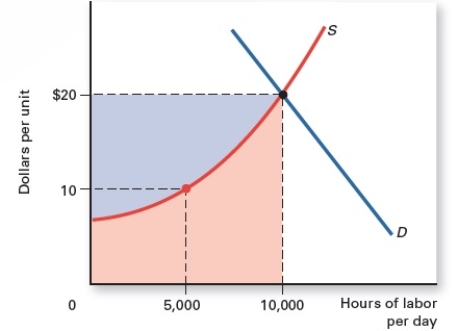
-Refer to Exhibit 11.9,which shows the demand and supply curves of a resource.The opportunity cost of the resource in equilibrium is represented by the area _____
A) above the supply curve and above $20.
B) above the supply curve and below $20.
C) below the supply curve and above $10.
D) below the supply curve and below $10.
E) below the supply curve and left of 10,000 units.
Correct Answer:
Verified
Q104: Suppose ten pretzels are sold at a
Q105: Exhibit 11.8 Q106: Exhibit 11.8 Q107: Exhibit 11.8 Q107: A resource's marginal product is Q108: Suppose two froyo machines and 12 workers Q110: The change in total product from employing Q111: Suppose 15 workers produce 100 license plates,16 Q112: If 14 workers produce a total of Q113: Exhibit 11.9 Unlock this Answer For Free Now! View this answer and more for free by performing one of the following actions Scan the QR code to install the App and get 2 free unlocks Unlock quizzes for free by uploading documents
![]()
![]()
![]()
A)the revenue produced
![]()

