Multiple Choice
Figure 11-3a 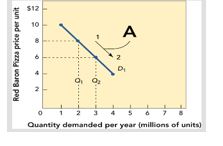
-Figure 11-3a shows that when the price for Red Baron frozen cheese pizzas moves from $8 to $6 per unit along the demand curve D1,the quantity demanded
A) increases from 2 to 3 million units per year.
B) decreases from 3 to 2 million units per year.
C) stays the same.
D) increases from 6 to 8 million units per year.
E) decreases from 8 to 6 million units per year.
Correct Answer:
Verified
Related Questions
Q141: Several companies produce latex gloves that are
Q146: If a firm finds the demand for
Q158: The percentage change in quantity demanded relative
Q166: There are a lot of skateboards on

