In the figure given below,the curve TT shows how the allocation of a resource affects the well-being of two individuals,Hank and Monica. 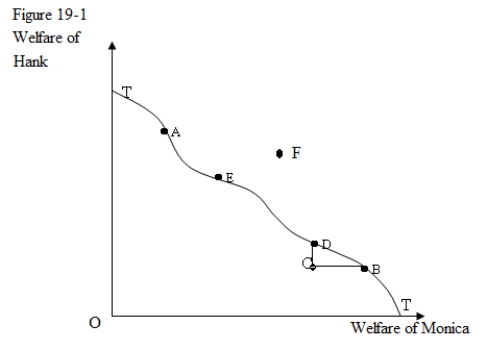
-In Figure 19-1,a move from C to D would:
A) be desirable because it produces a more equal distribution of resources.
B) be more desirable than a movement from C to B.
C) be desirable because a movement from an inefficient allocation of resources to an efficient allocation of resources is always preferred.
D) represent a movement from an inefficient allocation to an efficient allocation of resources.
Correct Answer:
Verified
Q25: A comparison between the resource allocation at
Q26: In Figure 19-2 given below,points A,B,C,and D
Q26: Which of the following is true of
Q28: Any two goods are said to be
Q30: In the figure given below,the curve TT
Q31: When the marginal rates of substitution differs
Q32: Two goods are said to be allocated
Q34: Assume that Jeff and Jane both consume
Q35: Which of the following is true of
Q37: The _ identifies the different distributions of
Unlock this Answer For Free Now!
View this answer and more for free by performing one of the following actions

Scan the QR code to install the App and get 2 free unlocks

Unlock quizzes for free by uploading documents