Figure 7-1 shows the total product curve for different levels of a variable input,labor.
Figure 7-1 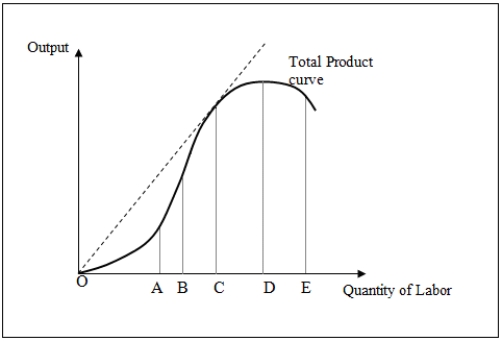
-Refer to Figure 7-1.To the left of point B:
A) marginal product is rising but average product is falling.
B) marginal product is rising and is above the average product.
C) marginal product is falling but average product is rising.
D) total product is increasing at a decreasing rate.
Correct Answer:
Verified
Q30: Which of the following statements is true
Q34: Figure 7-2 shows the total product curve
Q36: Figure 7-2 shows the total product curve
Q37: Figure 7-2 shows the total product curve
Q38: The slope of a ray from the
Q40: Figure 7-2 shows the total product curve
Q42: Figure 7-2 shows the total product curve
Q42: An isoquant shows _.
A)the different quantities of
Q51: In the long run,_.
A)the marginal cost of
Q54: The law of diminishing marginal returns _.
A)is
Unlock this Answer For Free Now!
View this answer and more for free by performing one of the following actions

Scan the QR code to install the App and get 2 free unlocks

Unlock quizzes for free by uploading documents