Figure 7-1 shows the total product curve for different levels of a variable input,labor.
Figure 7-1 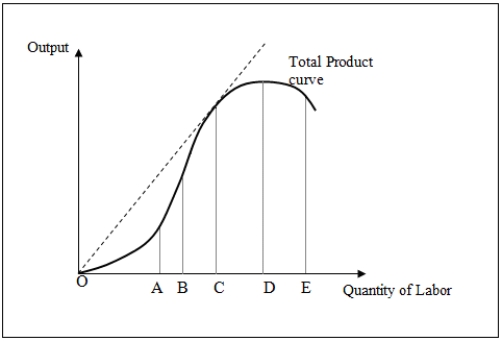
-Refer to Figure 7-1.A firm would choose to operate between points C and D because:
A) marginal product has already reached a maximum.
B) average product is rising over that range.
C) marginal product and average product are positive,but falling.
D) marginal product and average product are rising.
Correct Answer:
Verified
Q4: A technologically efficient level of output is
Q9: A farmer is growing corn on an
Q17: Table 7-3 shows the combinations of labor
Q19: A carpenter hammers nails each day at
Q21: Table 7-3 shows the combinations of labor
Q26: Figure 7-2 shows the total product curve
Q27: The average product of labor at a
Q27: Figure 7-1 shows the total product curve
Q31: When the total product curve with only
Q35: If total product is increasing at a
Unlock this Answer For Free Now!
View this answer and more for free by performing one of the following actions

Scan the QR code to install the App and get 2 free unlocks

Unlock quizzes for free by uploading documents