Figure 7-2 shows the total product curve for different levels of a variable input,labor.
Figure 7-2 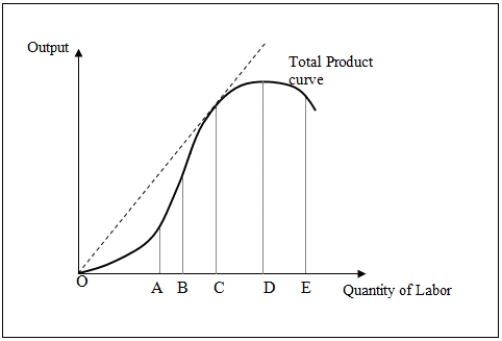
-In Figure 7-2,at point D _____.
A) total product is zero
B) marginal product is zero
C) average product is negative
D) average product reaches a maximum
Correct Answer:
Verified
Q40: Figure 7-2 shows the total product curve
Q42: An isoquant shows _.
A)the different quantities of
Q42: Figure 7-2 shows the total product curve
Q45: The duration of the short run varies
Q47: Figure 7-2 shows the total product curve
Q48: Figure 7-2 shows the total product curve
Q51: In the long run,_.
A)the marginal cost of
Q53: A production isoquant identifies _.
A)the maximum output
Q54: The law of diminishing marginal returns _.
A)is
Q55: The law of diminishing returns holds only:
A)for
Unlock this Answer For Free Now!
View this answer and more for free by performing one of the following actions

Scan the QR code to install the App and get 2 free unlocks

Unlock quizzes for free by uploading documents