Figure 7-2 shows the total product curve for different levels of a variable input,labor.
Figure 7-2 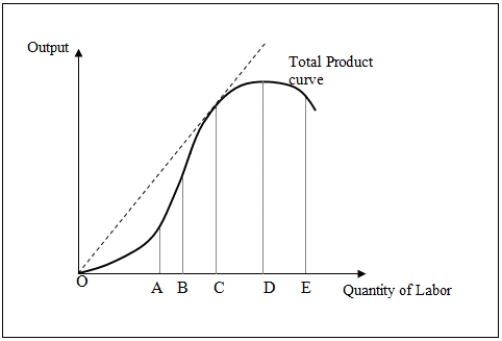
-In Figure 7-2,at point C _____.
A) average product equals marginal product
B) marginal product is at a maximum
C) total product is increasing at an increasing rate
D) average product is declining but positive
Correct Answer:
Verified
Q43: When the marginal and average products of
Q48: Which of the following is constant along
Q53: Figure 7-2 shows the total product curve
Q58: If the level of technical know-how increases,how
Q59: Isoquants that are farther away from the
Q60: According to the law of diminishing marginal
Q60: Table 7-2 shows the combinations of
Q63: If the marginal product of labor is
Q65: The marginal rate of technical substitution:
A)equals the
Q77: Which of the following statements about the
Unlock this Answer For Free Now!
View this answer and more for free by performing one of the following actions

Scan the QR code to install the App and get 2 free unlocks

Unlock quizzes for free by uploading documents