Figure 9-4 shows the marginal cost curve,average cost curve,average variable cost curve,and demand curve for a firm over different levels of output and at a market price of $P.
Figure 9-4 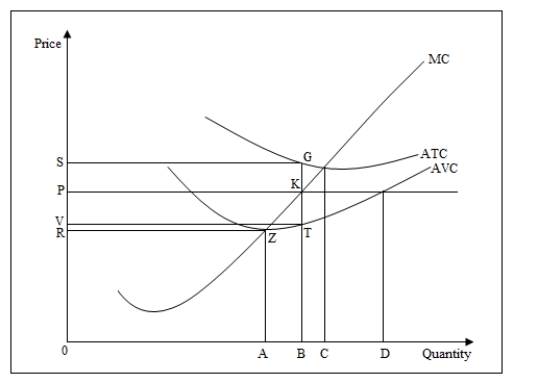
-Refer to Figure 9-4.At the output level OB the total fixed cost is equal to _____.
A) TBOV
B) KTVP
C) GKPS
D) GTVS
Correct Answer:
Verified
Q43: Following a significant decrease in the price
Q45: In the short-run,if a competitive firm finds
Q47: If market price is below a competitive
Q49: A significant decrease in the price of
Q52: Figure 9-4 shows the marginal cost curve,average
Q53: The following figure shows the marginal cost
Q56: In a perfectly competitive market,if the product
Q56: The following figure shows the marginal cost
Q57: The following figure shows the marginal cost
Q59: During the 1970s,oil prices reached historical highs,causing
Unlock this Answer For Free Now!
View this answer and more for free by performing one of the following actions

Scan the QR code to install the App and get 2 free unlocks

Unlock quizzes for free by uploading documents