The following figure shows the effect of a price ceiling in the market for yams.The market was initially in equilibrium at price P2 and quantity B.
Figure 10-1 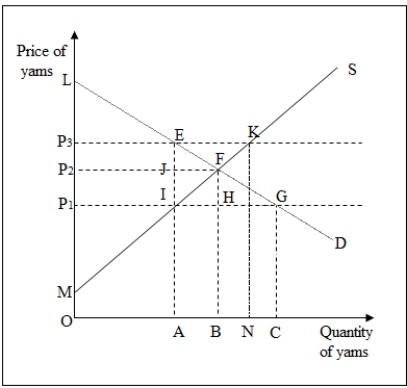
-Refer to Figure 10-1.The change in aggregate producer surplus due to a price ceiling set at P1 is area _____.
A) -EFI
B) EFJ - P2JIP1
C) -P2FIP1
D) P1IM
Correct Answer:
Verified
Q17: The following figure shows the intersection of
Q18: When a price ceiling is imposed in
Q19: The following figure shows the effect of
Q19: What is meant by producer surplus?
A)It is
Q20: When the efficient rate of output is
Q22: The following figure shows the effect of
Q23: The following figure shows the effect of
Q24: Consider two increasing-cost competitive industries (A and
Q25: The following figure shows the effect of
Q32: In the long run,the imposition of an
Unlock this Answer For Free Now!
View this answer and more for free by performing one of the following actions

Scan the QR code to install the App and get 2 free unlocks

Unlock quizzes for free by uploading documents