The following figure shows the demand and supply for a commodity in the domestic U.S.market as well as the global market.The commodity is imported from the rest of the world to the U.S.market.
Figure 10-3 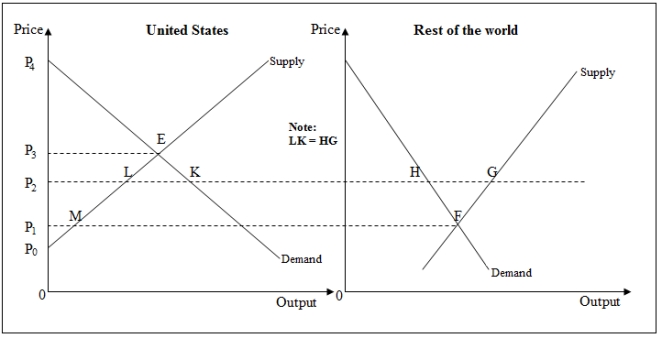
-In Figure 10-3,the net gain to the U.S.from trade is _____.
A) P3EP0
B) P3ELP2
C) P4EP0
D) ELK
Correct Answer:
Verified
Q47: Suppose there is a city which licenses
Q66: In 2002,the U.S.imposed higher tariffs on steel
Q69: In 2002,the U.S.imposed higher tariffs on steel
Q70: The following figure shows the intersection of
Q71: The following figure shows the domestic U.S.market
Q72: Which of the following is true of
Q73: The following figure shows the demand and
Q74: The following figure shows the intersection of
Q77: The following figure shows the demand and
Q78: The following figure shows the demand and
Unlock this Answer For Free Now!
View this answer and more for free by performing one of the following actions

Scan the QR code to install the App and get 2 free unlocks

Unlock quizzes for free by uploading documents