The following figure shows the weekly income (in dollars) and leisure (in hours) of a worker using an indifference curve and a budget line.
Figure 17-1 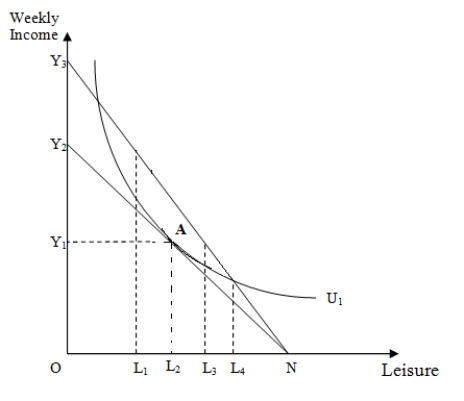
-Refer to Figure 17-1.If the number of leisure hours is OL3 after a change in the wage rate,the individual's supply curve of labor will be _____.
A) backward bending
B) vertical
C) upward-sloping
D) relatively elastic
Correct Answer:
Verified
Q2: As a result of the substitution effect
Q5: As a result of the substitution effect
Q7: As a result of the income effect
Q9: In the income-leisure model of work,leisure is
Q10: The following figure shows the weekly income
Q11: Which of the following best explains the
Q15: Suppose leisure is shown on the horizontal
Q16: The following figure shows the weekly income
Q18: Consider an individual whose income increases substantially.This
Q19: Suppose a worker is working 40 hours
Unlock this Answer For Free Now!
View this answer and more for free by performing one of the following actions

Scan the QR code to install the App and get 2 free unlocks

Unlock quizzes for free by uploading documents