In the figure given below,D1 and S1 are the private demand and supply curves,of a commodity produced by a competitive firm.S2 reflects the social marginal cost of production,while S0 represents the external marginal cost. 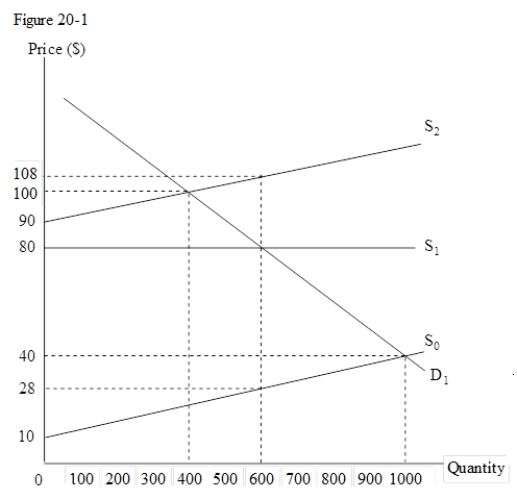
-Refer to Figure 20-1.A comparison between the efficient outcome and the market equilibrium reveals that:
A) the price level when the outcome is efficient is higher than the price at the market equilibrium by $30.
B) the price level when the outcome is efficient is lower than the price at the market equilibrium by $10.
C) the price level when the outcome is efficient is lower than the price at the market equilibrium by $40.
D) the price level when the outcome is efficient is higher than the price at the market equilibrium by $20.
Correct Answer:
Verified
Q63: In the figure given below,the competitive supply
Q64: In the figure given below,D1 and S1
Q65: Which of the following will hold true
Q66: In the figure given below,the competitive supply
Q66: The marginal social cost and marginal private
Q67: Reducing automobile pollution beyond a certain point
Q68: In the figure given below,the competitive supply
Q69: In the figure given below,the competitive supply
Q69: If the production of a certain commodity
Q71: In the figure given below,the competitive supply
Unlock this Answer For Free Now!
View this answer and more for free by performing one of the following actions

Scan the QR code to install the App and get 2 free unlocks

Unlock quizzes for free by uploading documents