In the figure given below,the competitive supply curve of a commodity is given by S1,the private marginal benefit curve is D1,the marginal social benefit curve is D2,and the MBE curve reflects the marginal external benefits. 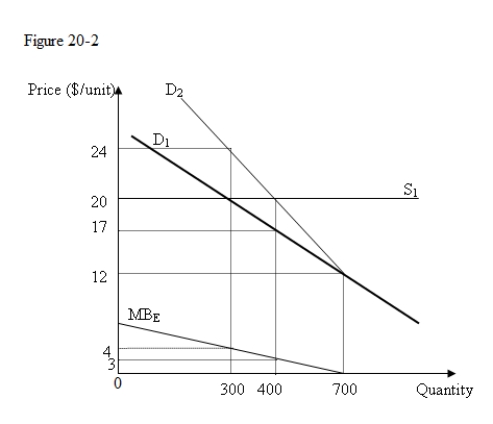
-In Figure 20-2,if the current level of output is 700 units,then the marginal social benefit is:
A) more than the marginal social cost and the output is more than the socially optimum level.
B) more than the marginal social cost and the output is less than the socially optimum level.
C) less than the marginal social cost and the output is more than the socially optimum level.
D) equal to the marginal social cost and the output is equal to the socially optimum level.
Correct Answer:
Verified
Q68: A tax used to internalize an external
Q74: In the figure given below,the competitive supply
Q76: In the figure given below,D1 and S1
Q77: Externalities mainly arise because:
A)consumers have more market
Q78: In the figure given below,D1 and S1
Q80: Which of the following statements is most
Q82: Suppose an electric utility company expects to
Q84: The Red List of Threatened Species,compiled by
Q95: Mention some of the situations in which
Q96: Taxes imposed on polluting firms,for internalizing the
Unlock this Answer For Free Now!
View this answer and more for free by performing one of the following actions

Scan the QR code to install the App and get 2 free unlocks

Unlock quizzes for free by uploading documents