Multiple Choice
FIGURE 12-5 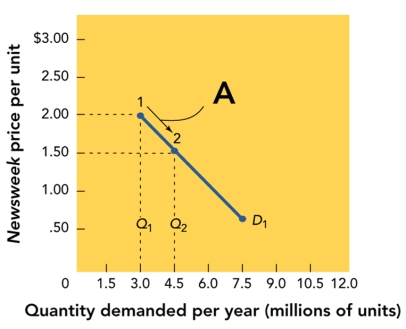
-Figure 12-5 above shows that when the price moves from $2.00 to $1.50 per unit, the quantity demanded
A) increases from 3.0 to 4.5 million units per year.
B) decreases from 4.5 to 3.0 million units per year.
C) increases from 3.0 to 7.5 million units per year.
D) decreases from 7.5 to 3.0 million units per year.
E) stays the same.
Correct Answer:
Verified
Related Questions
Q148: While consumer tastes and price and availability

