FIGURE 10-6 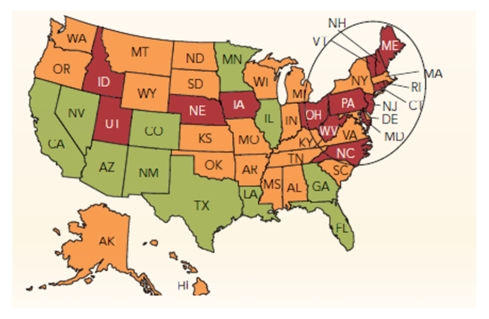
-In the Marketing dashboards shown in Figure 10-6 above, "green" indicates an annual growth rate that is greater than 10%; "orange" signifies an annual growth rate of between 0%-10%; and "red" represents a decline or negative annual growth rate.If an organization's 2010 sales for entire U.S.were $50 million and its 2009 U.S.sales were $30 million.The annual % of sales change is 150%.Identify three possible marketing actions you would consider to reverse the decline in annual sales growth in the "red" states.
Correct Answer:
Verified
View Answer
Unlock this answer now
Get Access to more Verified Answers free of charge
Q217: How could a firm use a test
Q264: Characterize the difference between a product line
Q266: Define derived demand and provide an example
Q339: Describe the different ways to classify a
Q341: List two reasons why test marking certain
Q342: FIGURE 10-8 Q343: Compare continuous, dynamically continuous, and discontinuous innovations.Provide Q346: What is idea generation? From where can Q348: FIGURE 10-7 Q350: Where would potatoes, a photographic studio, and![]()
![]()
Unlock this Answer For Free Now!
View this answer and more for free by performing one of the following actions

Scan the QR code to install the App and get 2 free unlocks

Unlock quizzes for free by uploading documents