FIGURE 2-10 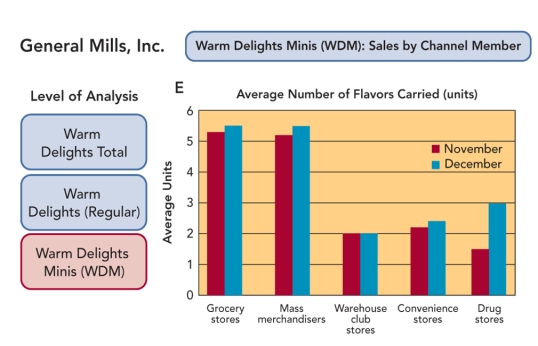
-The bar graph in Figure 2-10 above demonstrates
A) the total amount spent by customers from November to December.
B) preference of Warm Delights Minis over Warm Delights (regular) .
C) shopping preferences of customers amongst different channel members.
D) the level of analysis for sales results for the total Warm Delights sales.
E) This bar chart shows the average number of flavors of Warm Delights Minis carried by each store in the channel, the maximum possible being 6.0.But note that the Warm Delights Minis went from having only 1.4 flavors carried by the average drugstore in November to 3.0 in December, a trend worth investigating.
Correct Answer:
Verified
Q276: Name and briefly describe the seven types
Q277: Which of the following types of test
Q278: What is a corporate mission? What are
Q279: The three "buttons" on the left-hand column,
Unlock this Answer For Free Now!
View this answer and more for free by performing one of the following actions

Scan the QR code to install the App and get 2 free unlocks

Unlock quizzes for free by uploading documents