The following graph depicts the market for CT scanners in the United States. 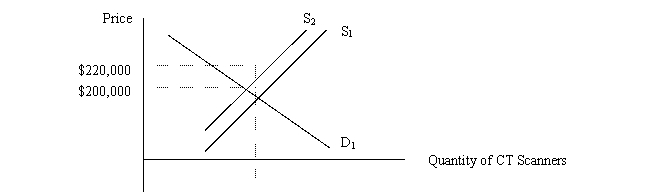 Assume an initial equilibrium at D1 and S1 with price of $200,000 per machine.If the government places a $20,000 excise tax on each new scanner sold, the new equilibrium price will be
A) at least $220,000.
B) exactly $220,000.
C) less than $220,000.
D) there's not enough information to determine what the new price will be.
Correct Answer:
Verified
Q7: use the following scenario.You are a consultant
Q8: Suppose the market for hospital outpatient treatment
Q9: Within the framework of economics, optimization means
Q10: Which of the following will not change
Q10: A physician's office expenses increase 10 percent,so
Q11: use the following scenario.You are a consultant
Q13: Suppose the U.S.Drug Enforcement Agency steps up
Q15: use the following scenario.You are a consultant
Q16: Suppose angioplasty and coronary artery bypass graft
Q17: Suppose the demand curve for medical care
Unlock this Answer For Free Now!
View this answer and more for free by performing one of the following actions

Scan the QR code to install the App and get 2 free unlocks

Unlock quizzes for free by uploading documents