Suppose that you construct the histogram in Figure 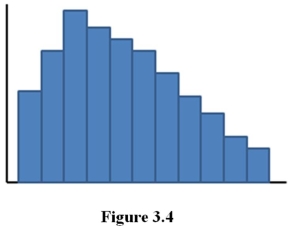
What conclusions would you draw about the data? Explain.
Correct Answer:
Verified
View Answer
Unlock this answer now
Get Access to more Verified Answers free of charge
Q19: When is the mean most appropriate for
Q20: A scatter diagram is potentially valuable because
Q21: The correlation coefficient is generally preferred to
Q22: a.If the correlation coefficient between two random
Q23: The correlation coefficient is
A)must be positive.
B)the square
Q24: Suppose you have collected the data
Q25: The covariance
A)measures the linear relationship between two
Q27: In your own words,describe the potential benefits
Q28: List and describe the steps involved in
Q29: A counselor working with teenagers is
Unlock this Answer For Free Now!
View this answer and more for free by performing one of the following actions

Scan the QR code to install the App and get 2 free unlocks

Unlock quizzes for free by uploading documents