A statistics professor classifies his students according to their grade point average (GPA) and their gender.The resulting cross-classification table is shown below. 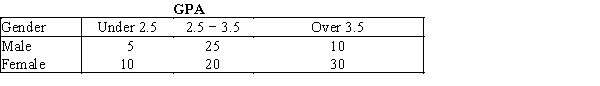 Which of the following describes the relationship between GPA and gender shown by this table?
A) A higher percentage of females have GPAs over 3.5,compared to males.
B) A lower percentage of females have GPAs over 3.5,compared to males.
C) Females and males each have the same percentage of GPAs over 3.5.
D) You cannot compare male and female GPAs because the total number in each group is not the same.
Correct Answer:
Verified
Q56: A pie chart is used to represent
Q57: Car Buyers Forty car buyers were asked
Q58: A pie chart shows the _ of
Q59: Business School Graduates A sample of
Q60: Business School Graduates A sample of
Q62: In the following cross-classification table,gender and fantasy
Q63: Suppose you measure the number of minutes
Q64: When studying the responses to two nominal
Q65: In the following cross-classification table,gender and car
Q66: The bar charts below summarize data collected
Unlock this Answer For Free Now!
View this answer and more for free by performing one of the following actions

Scan the QR code to install the App and get 2 free unlocks

Unlock quizzes for free by uploading documents