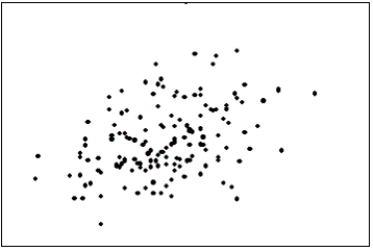
The first scatter diagram below shows a stronger linear relationship than the second scatter diagram.(Assume the scales on both scatter diagrams are the same.) 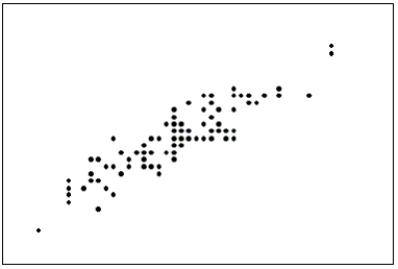
Correct Answer:
Verified
Q93: The scatter diagram below depicts data with
Q94: In applications involving two variables,X and Y,where
Q95: The relationship between two interval variables is
Q96: If we draw a straight line through
Q97: Which of the following describes a positive
Q99: Which of the following statements is false?
A)You
Q100: The two most important characteristics to examine
Q101: An individual's income depends somewhat on their
Q102: Graphical excellence gives the greatest number of
Q103: The two most important characteristics to look
Unlock this Answer For Free Now!
View this answer and more for free by performing one of the following actions

Scan the QR code to install the App and get 2 free unlocks

Unlock quizzes for free by uploading documents