Oil Quality and Price
Quality of oil is measured in API gravity degrees--the higher the degrees API,the higher the quality.The table shown below is produced by an expert in the field who believes that there is a relationship between quality and price per barrel. 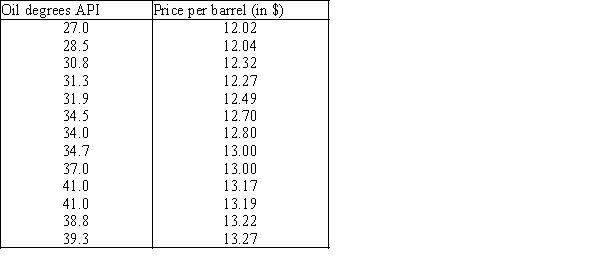 A partial Minitab output follows: Descriptive Statistics Variable N Mean StDev SE Mean Degrees 13 34.60 4.613 1.280 Price 13 12.730 0.457 0.127 Covariances Degrees Price Degrees 21.281667 Price 2.026750 0.208833 Regression Analysis Predictor Coef StDev T P Constant 9.4349 0.2867 32.91 0.000 Degrees 0.095235 0.008220 11.59 0.000 S = 0.1314 R−Sq = 92.46% R−Sq(adj)= 91.7% Analysis of Variance Source DF SS MS F P Regression 1 2.3162 2.3162 134.24 0.000 Residual Error 11 0.1898 0.0173 Total 12 2.5060
-{Oil Quality and Price Narrative} Use the regression equation 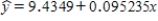 to determine the predicted values of y.
Correct Answer:
Verified
View Answer
Unlock this answer now
Get Access to more Verified Answers free of charge
Q285: Oil Quality and Price
Quality of oil
Q286: Comedy Shows Revenues
A financier whose specialty
Q287: Marc Anthony Concert
At a recent Marc
Q288: Marc Anthony Concert
At a recent Marc
Q289: Comedy Shows Revenues
A financier whose specialty
Q291: Game Winnings & Education
An ardent fan
Q292: Oil Quality and Price
Quality of oil
Q293: Marc Anthony Concert
At a recent Marc
Q294: Marc Anthony Concert
At a recent Marc
Q295: Oil Quality and Price
Quality of oil
Unlock this Answer For Free Now!
View this answer and more for free by performing one of the following actions

Scan the QR code to install the App and get 2 free unlocks

Unlock quizzes for free by uploading documents