The trend line and seasonal indexes shown below were computed from four weeks of daily observations.Forecast the seven values for the next week.
Trend Line:  = 145 + 1.66t (t = 1,2,3,...28)
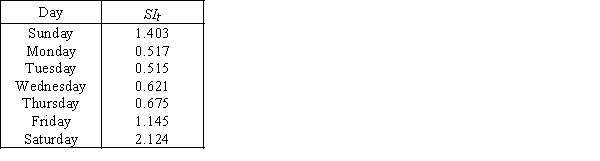
Correct Answer:
Verified
Q4: The method of least squares is used
Q142: The regression trend line for annual energy
Q143: To create a seasonally adjusted time series,divide
Q144: Holiday Hours
The total holiday hours (in
Q145: The easiest way of measuring the long-term
Q146: A model that can be used to
Q148: A least squares _ trend line is
Q149: Which of the following models might be
Q150: Which of the following statements is true?
A)In
Q152: Given the following time series,compute the seasonal
Unlock this Answer For Free Now!
View this answer and more for free by performing one of the following actions

Scan the QR code to install the App and get 2 free unlocks

Unlock quizzes for free by uploading documents