Essay
The trend line  = 500 + 30t,(t = 1,2,3,....,20),and the seasonal indexes shown in the table below were computed from five years of quarterly sales data.Forecast the sales for the next four quarters.
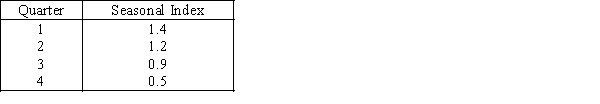
Correct Answer:
Verified
Related Questions
Q159: Carpet Outlet
A carpet outlet has been
Q160: Holiday Hours
The total holiday hours (in
Q161: Coffee Imports
The coffee imports (in millions
Q162: ebay Storefront Sales
The sales figures (in
Unlock this Answer For Free Now!
View this answer and more for free by performing one of the following actions

Scan the QR code to install the App and get 2 free unlocks

Unlock quizzes for free by uploading documents