A time series is shown in the table below: 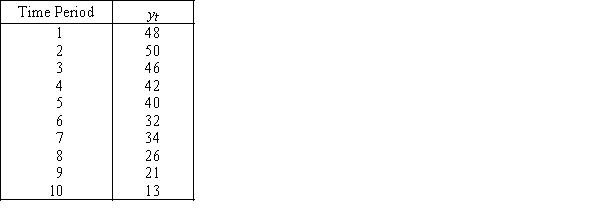
a.Plot the time series to determine which of the trend models appears to fit better.
b.Use the regression technique to calculate the linear trend line and the quadratic trend line.Which line fits better? Use the best model to forecast the value of y for time period 7.
Correct Answer:
Verified
View Answer
Unlock this answer now
Get Access to more Verified Answers free of charge
Q192: Hotel Occupancy
A small hotel has recorded the
Q193: If the time series displays a gradual
Q194: The mean absolute deviation is a measure
Q195: If there is no obvious trend or
Q196: If the time series is composed of
Q198: The mean absolute deviation averages the absolute
Q199: Hotel Occupancy
A small hotel has recorded the
Q200: Which method would you recommend to your
Q201: The most commonly used measures of forecast
Q202: The actual and forecast values of a
Unlock this Answer For Free Now!
View this answer and more for free by performing one of the following actions

Scan the QR code to install the App and get 2 free unlocks

Unlock quizzes for free by uploading documents