A time series for the years 1996-2001 is shown below. 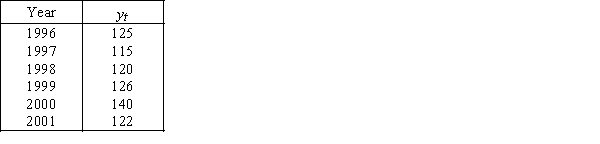 The forecasts for the years 2002-2004 with three smoothing constant values are:
With w = .2,F2002 = F2003 = F2004 = 125.60
With w = .5,F2002 = F2003 = F2004 = 126.75
With w = .6,F2002 = F2003 = F2004 = 126.55
Compare each of the three sets of forecasts with the actual values for 2002-2004 given in the accompanying table,and compute the mean absolute deviation (MAD)for each model.Which model is best? 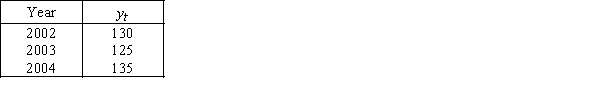
Correct Answer:
Verified
View Answer
Unlock this answer now
Get Access to more Verified Answers free of charge
Q215: If avoiding large errors is important,_ should
Q216: An estimated first-order autoregressive model for stock
Q217: To assess the adequacy of a forecasting
Q218: The autoregressive model Q219: The following is the list of mean Q220: An estimated second-order autoregressive model for average Q221: In time series regressions the seasonal variation Q222: In time series regressions the random variation Q223: In time series regressions the time trend Q225: The actual and forecast values of a![]()
Unlock this Answer For Free Now!
View this answer and more for free by performing one of the following actions

Scan the QR code to install the App and get 2 free unlocks

Unlock quizzes for free by uploading documents