30 Samples Production Thirty samples of size 4 were drawn from a production process.The data are shown below. 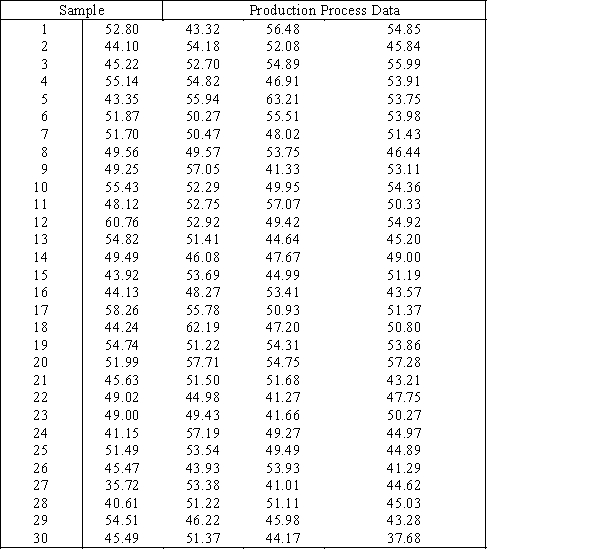
-{30 Samples Production Narrative} Looking at the  chart developed in a previous question,you see indications of a possible level shift as well as cyclic variation.Explain how the chart shows this,and give a possible explanation.
Correct Answer:
Verified
View Answer
Unlock this answer now
Get Access to more Verified Answers free of charge
Q111: Control limits for the p chart are
Q112: 40 samples of size 800 were drawn
Q113: A control chart used to monitor a
Q114: 40 Samples Manufacturing
The mean of
Q115: 20 samples of size 1,500 were drawn
Q117: 40 samples of size 2,500 were taken
Q118: When the purpose of sampling is to
Q119: The lower and upper control limits for
Q120: To ensure that a manufacturing process is
Q121: 50 samples of size 2,000 were taken
Unlock this Answer For Free Now!
View this answer and more for free by performing one of the following actions

Scan the QR code to install the App and get 2 free unlocks

Unlock quizzes for free by uploading documents