Which of these diagrams represents an age structure diagram of more-developed countries? 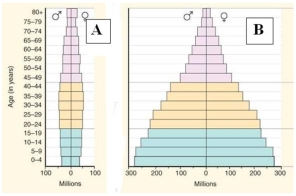
A) Diagram A
B) Diagram B
Correct Answer:
Verified
Q22: A(n)_ consists of all the populations of
Q23: Farmers sprayed leechi trees to suppress populations
Q24: Only the LDCs will be experiencing overpopulation
Q27: The sequence of decreased death rate followed
Q28: Many species are held below the environmental
Q29: A population in which death rates are
Q36: Density-independent factors which play a role in
Q37: Since the population of the LDCs is
Q41: When the number of births plus immigration
Q48: Parasitism,competition,and predation are density-independent factors that help
Unlock this Answer For Free Now!
View this answer and more for free by performing one of the following actions

Scan the QR code to install the App and get 2 free unlocks

Unlock quizzes for free by uploading documents