Refer to the accompanying diagram to answer the following questions :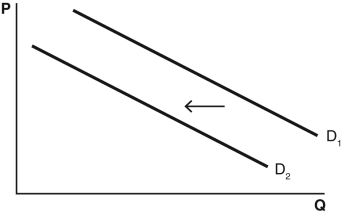
-The demand curve shift shown in the figure was caused by a(n)
A) increase in the input cost of the good.
B) increase in the price of a substitute of the good.
C) decrease in the number of firms selling the good.
D) decrease in the number of buyers in the market for the good.
E) expectation that the future price of this good will be higher than it is currently.
Correct Answer:
Verified
Q37: Which of the following would cause the
Q38: Refer to the table below: Q39: Which of the following would cause a Q40: If the price of pants increases,what would Q41: The demand curve for a good will Q43: As the life expectancy in the United Q44: As more people migrated West during the Q45: Katarina drives past the same gas station Q46: Refer to the accompanying figure.When the price Q47: When the price falls,what happens?![]()
A) There is
Unlock this Answer For Free Now!
View this answer and more for free by performing one of the following actions

Scan the QR code to install the App and get 2 free unlocks

Unlock quizzes for free by uploading documents