Use the following graph to answer the following questions.
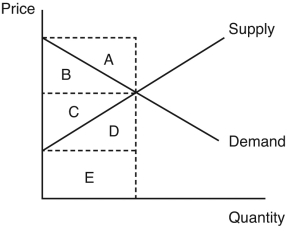
-In the figure,which region represents the consumer surplus?
A) area A
B) area B
C) area C
D) area D
E) area E
Correct Answer:
Verified
Q10: The difference between the willingness to pay
Q11: When the price of a good increases
Q12: Use the following graph to answer the
Q13: Consumer surplus is defined as the
A) difference
Q14: All else held constant,a decrease in the
Q16: Another name for a consumer's willingness to
Q17: Producer surplus is the difference between
A) supply
Q18: For a given good,a consumer's willingness to
Q19: Use the following graph to answer the
Q20: Holding all else constant,when the price of
Unlock this Answer For Free Now!
View this answer and more for free by performing one of the following actions

Scan the QR code to install the App and get 2 free unlocks

Unlock quizzes for free by uploading documents