Use the following graph to answer the following questions.
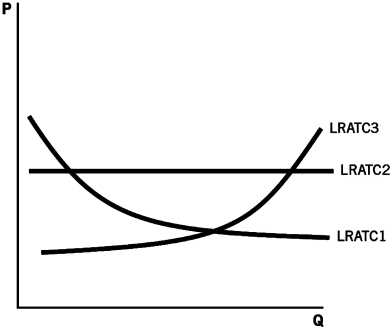
-A firm expands its scale of production and finds that its long-run average total cost curve looks like LRATC1.It might look this way because the firm
A) adds several additional layers of management,which increase its costs.
B) is able to pay its employees more.
C) has to pay higher rent.
D) is able to negotiate lower prices with its suppliers.
E) is able to sell more output.
Correct Answer:
Verified
Q102: Where would we find a firm's minimum
Q103: Annabelle owns an Italian ice shop.If she
Q104: Should a firm always produce the level
Q105: If the marginal product of labor is
Q106: Josephina owns a boxing gym.She recently expanded
Q108: Which of the following is a question
Q109: It is important for a firm to
Q110: Refer to the following table.What is the
Q111: Which is the best example of economies
Q112: If a firm experiences diminishing marginal product
Unlock this Answer For Free Now!
View this answer and more for free by performing one of the following actions

Scan the QR code to install the App and get 2 free unlocks

Unlock quizzes for free by uploading documents