Refer to the following graphs to answer the following questions:
A. 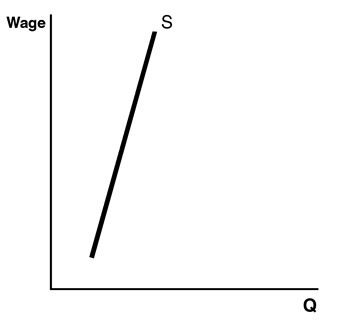
B.11efbc7a_aae2_b1ce_a154_5b2bc6d63cd5_TB4871_00
C. 11efbc7b_3472_260f_a154_33be1c4f264b_TB4871_00
D.11efbc7b_3e43_4570_a154_e989ac5b41ce_TB4871_00
E.11efbc7b_469c_1cb1_a154_3fa9426f32a6_TB4871_00
-Which graph shows a person who has a fixed quantity of hours that he or she is willing to work per week?
A) Graph A
B) Graph B
C) Graph C
D) Graph D
E) Graph E
Correct Answer:
Verified
Q49: More job opportunities open up in the
Q50: If you know that the substitution effect
Q51: When people make more money,they sometimes take
Q52: The minimum wage is increased to $15.This
Q53: When the opportunity cost of leisure is
Q55: Rowan is deciding whether to pick up
Q56: Ummal travels back in time to deposit
Q57: The citizens of Robbinsville notice that their
Q58: When Franklin earns more income but still
Q59: When their wages rise,Raymond works more and
Unlock this Answer For Free Now!
View this answer and more for free by performing one of the following actions

Scan the QR code to install the App and get 2 free unlocks

Unlock quizzes for free by uploading documents