The following table identifies the real value of exports,imports,and gross domestic product (GDP) for the U.S.economy,measured in billions of dollars for a series of years.Use the table to answer the following questions:
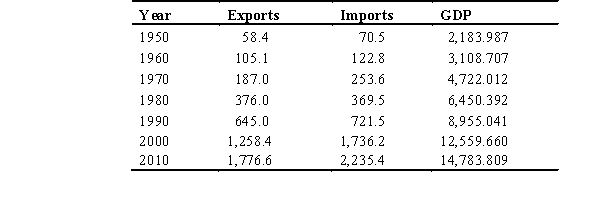
-According to the table,across the 60-year period,the real value of exports ________ and the real value of exports as a percentage of GDP ________.
A) increased; decreased
B) increased; increased
C) increased; fluctuated up and down
D) decreased; increased
E) fluctuated up and down; fluctuated up and down
Correct Answer:
Verified
Q20: Trade balance is
A) the sum of a
Q21: The ability of one person or nation
Q22: Citizens can consume the largest quantities of
Q23: Which country has the world's biggest economy?
A)
Q24: The following table identifies the real value
Q26: In 2011,60 percent of goods imported by
Q27: For nearly four decades,the United States has
Q28: The ability of one person or nation
Q29: Which two countries buy the most U.S.exports?
A)
Q30: Which of the following international organizations,founded in
Unlock this Answer For Free Now!
View this answer and more for free by performing one of the following actions

Scan the QR code to install the App and get 2 free unlocks

Unlock quizzes for free by uploading documents