A company has the information shown in the chart below regarding its forecast performance in the past three periods. 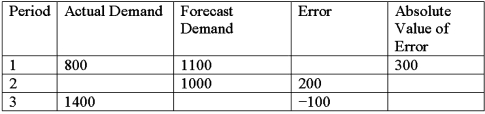 What is the mean absolute deviation (MAD) ?
A) 200
B) 225
C) -66.67
D) 1200
Correct Answer:
Verified
Q2: Suppose your firm is about to launch
Q6: Jones Company had sales of $100,000 last
Q7: Alpha Company sold 2,000 widgets yesterday.It had
Q10: The primary difference between demand management and
Q10: Assume that the forecast for the last
Q11: Assume that the forecast for the last
Q11: An office manager forecasts demand for office
Q16: In recent years some companies have begun
Q17: For Platinum Nugget Hotel in Las Vegas,
Q18: Strategic demand planning would best be utilized:
A)To
Unlock this Answer For Free Now!
View this answer and more for free by performing one of the following actions

Scan the QR code to install the App and get 2 free unlocks

Unlock quizzes for free by uploading documents