Sample means and ranges were obtained for five samples of 10 units per sample from a production process. Assume the process was considered to be in control during the period these samples were collected. The results are as follows: 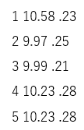
LCL for the three sigma X chart for the process is approximately (for a sample size of 10, A2 = 0.31) :
A) 10.12.
B) 10.05.
C) 10.94.
D) 9.44.
E) 9.75.
Correct Answer:
Verified
Q1: You are given the following data for
Q2: The specifications for the diameter of a
Q4: Which of the following categories of causes
Q5: Suppose that you are a process manager
Q6: The specifications for the diameter of a
Q7: You have been given the following data:
Q9: The two types of data involved in
Q12: Sample means and ranges were obtained for
Q14: A firm has an existing process that
Q20: "Pass/ fail" and "go/no go" are both
Unlock this Answer For Free Now!
View this answer and more for free by performing one of the following actions

Scan the QR code to install the App and get 2 free unlocks

Unlock quizzes for free by uploading documents