Multiple Choice
Picture (1) shows the electron populations of the bands of MO energy levels for elementary silicon. 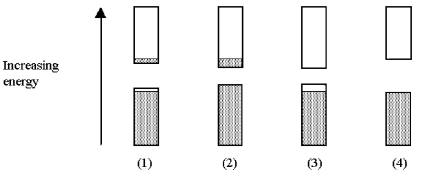
-Which picture (1) -(4) shows the electron populations when the silicon is doped with gallium?
A) picture (1)
B) picture (2)
C) picture (3)
D) picture (4)
Correct Answer:
Verified
Related Questions
Q82: Q83: The following pictures show the electron populations Q84: The following pictures show the electron populations Q85: The following picture shows the electron populations![]()
Unlock this Answer For Free Now!
View this answer and more for free by performing one of the following actions

Scan the QR code to install the App and get 2 free unlocks

Unlock quizzes for free by uploading documents