Figure 2-6 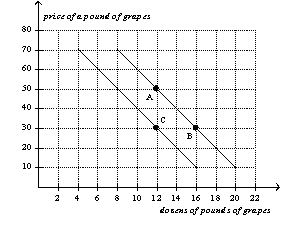
-Refer to Figure 2-6.The movement from point A to point B is a(n)
A) shift of the demand curve.
B) indication of a change in preferences for grapes.
C) movement along the demand curve.
D) indication of an increase in income.
Correct Answer:
Verified
Q64: Using the outline below,draw a circular-flow diagram
Q87: When economists are trying to explain the
Q103: According to John Maynard Keynes, an economist
Q129: When a variable that is not named
Q134: Changes in one variable on a graph
Q181: Draw a production possibilities frontier showing increasing
Q265: When a relevant variable that is not
Q334: In the past,environmentalists thought of economics as
Q345: In the ordered pair (17,75),75 is the
A)
Q386: Figure 2-16
In the following graph the x-axis
Unlock this Answer For Free Now!
View this answer and more for free by performing one of the following actions

Scan the QR code to install the App and get 2 free unlocks

Unlock quizzes for free by uploading documents