Figure 27-5.On the graph,x represents risk and y represents return. 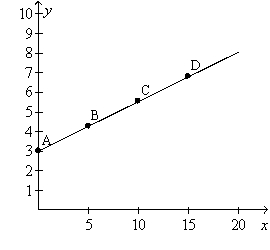
-Refer to Figure 27-5.Which of the following statements is correct?
A) At point A the standard deviation of the portfolio is 3.
B) A risk averse person always will choose to be at point A.
C) At point D the portfolio consists of about 15 percent stocks and 85 percent safe assets.
D) The figure shows that the greater the risk,the greater the return.
Correct Answer:
Verified
Q1: Figure 27-1.The figure shows a utility function.
Q5: A high-ranking corporate official of a well-known
Q7: If the efficient markets hypothesis is correct,then
A)the
Q7: Risk aversion helps to explain various things
Q25: The problem of moral hazard arises because
A)life
Q31: Figure 27-1.The figure shows a utility
Q33: A measure of the volatility of a
Q53: In effect,an annuity provides insurance
A)against the risk
Q70: Which of the following best illustrates moral
Q195: A company that produces computer peripherals is
Unlock this Answer For Free Now!
View this answer and more for free by performing one of the following actions

Scan the QR code to install the App and get 2 free unlocks

Unlock quizzes for free by uploading documents